Improved Work Reports and Analytics
27. March 2013
 We just deployed a major update to WorkTrail's work reports and statistics. The filter form has been improved to allow to search for work based on projects, tasks and multiple employees. It is now also possible to exclude multiple tasks from the query. In addition we improved Excel export and added a "Sunburst" chart which shows a hierarchical pie chart showing projects and containing tasks on one charts. Read on for more details.
Advanced Filter
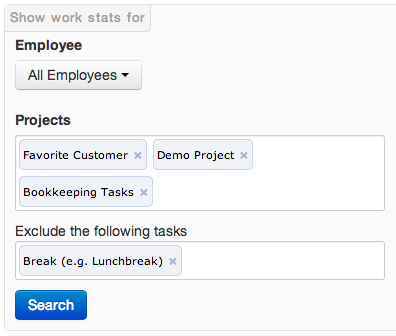 The old filter form was very basic, allowing only filtering for one employee and one project. We very much improved on this to allow filtering for multiple projects, multiple tasks, excluding specific tasks from the query and selecting custom date ranges.
Employees
You can select either each employee on their own, or select all. When clicking on the drop down you will receive a list of all employees of your company (If you are a manager).
Projects and Tasks
Below employees you can select projects and tasks to include in your query. If you select a project all work entries of all tasks of this project are included. You can additionally select more tasks in the 'Tasks' field - those will be selected in addition to all tasks of the selected projects in the Project filter.
Excluding Tasks
Earlier you could select to exclude "Unassigned and Break tasks". Now it is possible to exclude each single task individually. To make it as easy as before to the right of the Exclude field are two buttons which will add the Unassigned and Break task, respectively to the exclusion form.
Custom Date Range
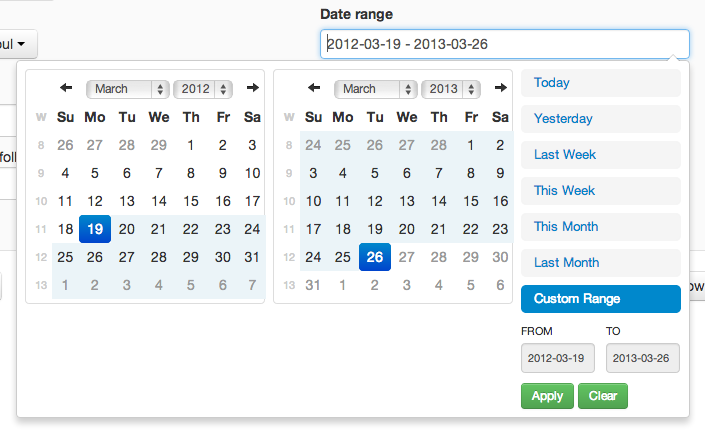 In addition to all task and employee filter you can now select a custom date range. When selecting "Custom Range" you can select the begin date in the left calendar, and the end date of the right calendar.
Improved Excel Reports
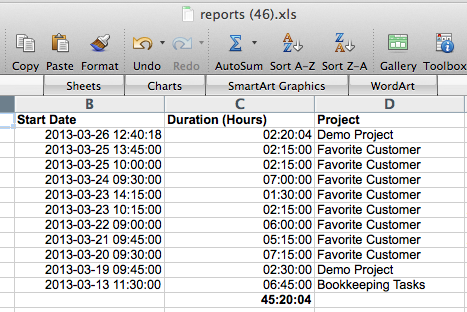 For most users Excel export is the easiest way to work with their collected work time. To make it even easier we improved formatting and already added sums to the download. Simply click the "Download for Microsoft Excel" button in the reports and try it out!
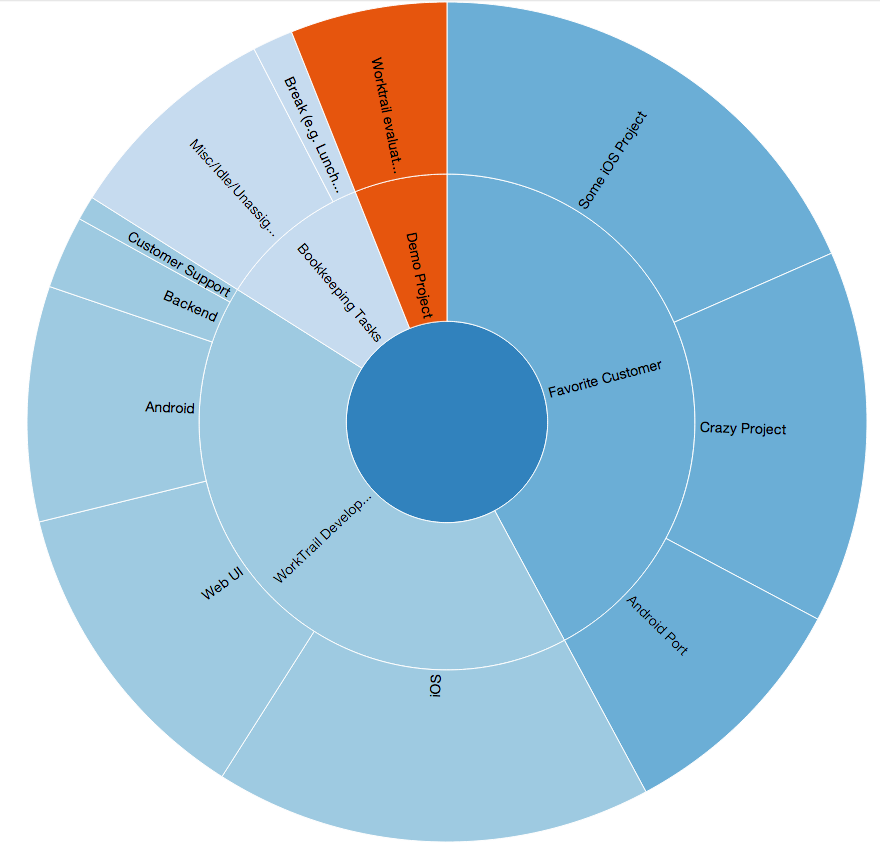
Sunburst Charts for Project / Task hierarchy
We added a sneak peak for improved charts in our reports. You can view them by clicking the "Beta: Show Sunburst" button in the work reports. The main advantage of this chart is that you can see all work time grouped by Project. It is also possible to zoom into each project and see the distribution of all tasks in that project. Here is a example screenshot: